
York City Centre Insights Q1-2024
Our quarterly report brings together data from multiple, credible sources as a means of measuring the economic performance of York city centre. The figures shown below are representative of the 3-month period during quarter 1 (Jan-Mar) 2024, identifying key insights such as footfall, spend and hotel occupancy. Insights focus on the percentage difference in metrics witnessed over quarterly and monthly time periods.
FOOTFALL
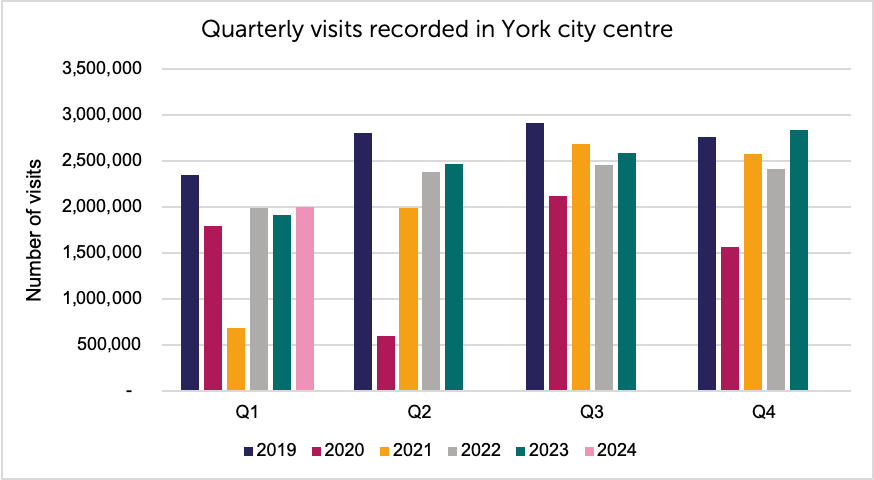
The number of visitors to York city centre recorded during quarter 1 (Jan-Mar) of 2024 was up by 4.6% when compared to the same period in the previous year (See figure 1).
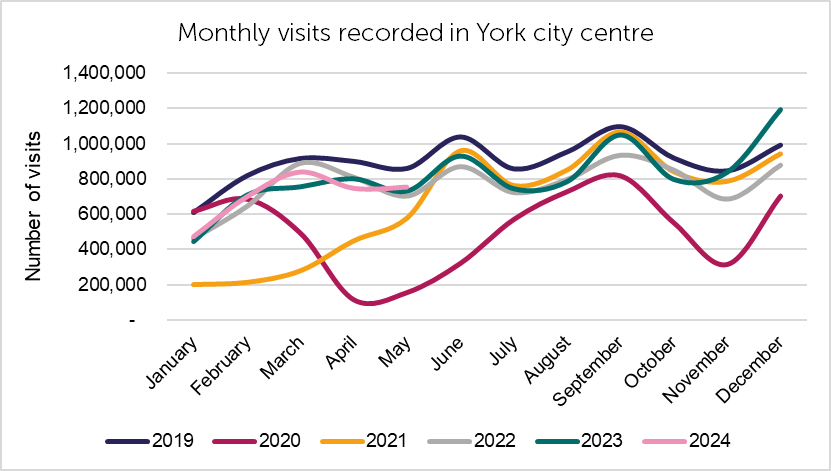
The highest number of monthly visitors during quarter 1 was recorded during March which, according to data published by Springboard data, was up by 10.4% compared to the previous year (See figure 2).
SPEND
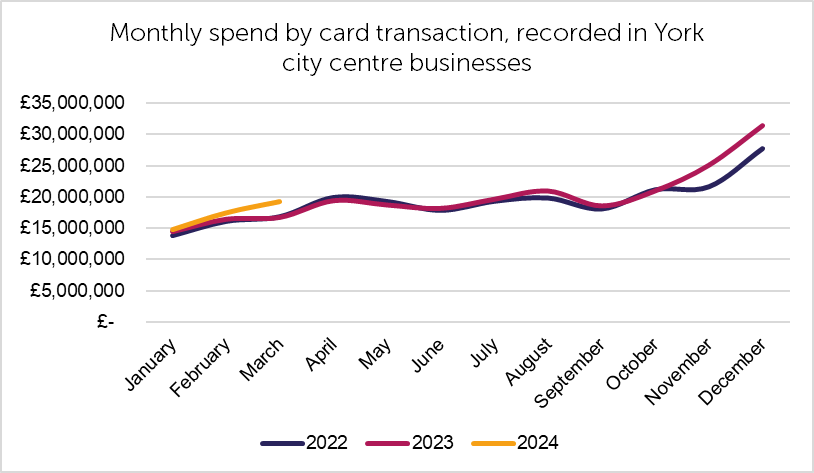
Spend made via VISA card transactions in city centre businesses during quarter 1 was up by 8.2% compared to the same period in the previous year (See figure 3). The total number of card transactions was up by 24.4% where as average spend per transaction was down by -13.8%.
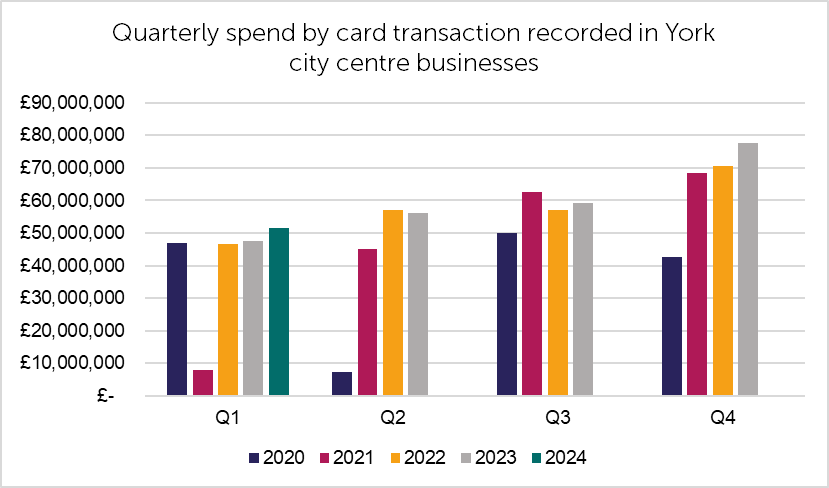
(source: VISA). Amounts do not include spend made by overseas visitors.
The highest monthly spend total was recorded during March, which was up by 15.0% compared to the same month in the previous year (See figure 4). Some of the comparative increase in spending levels may be due to inflation and the increased price of goods.
ORGIN OF SPEND/VISITATION
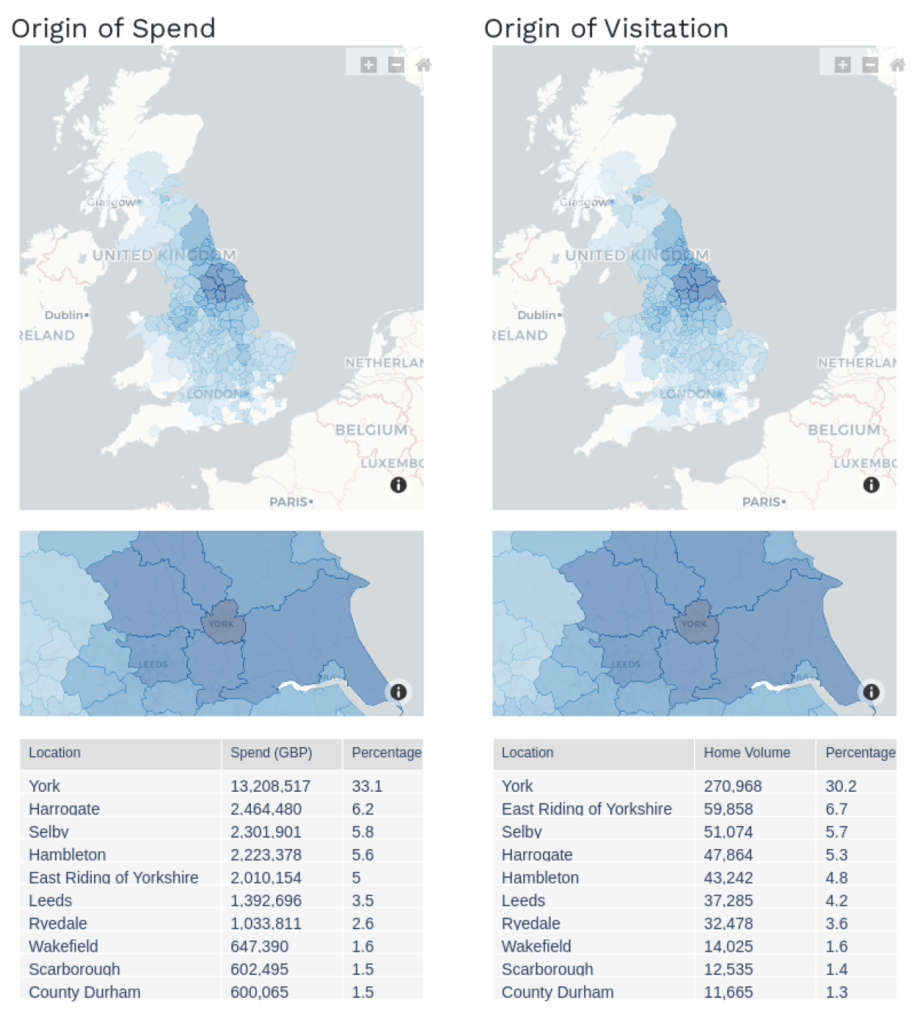
Out of the total number of visits recorded during quarter 1, 30.2% were made by residents of York Local Authority area, whereas 36.6% travelled from over 50km away.
Out of the total spend recorded during quarter 1, 33.1% was made by residents of York Local Authority area, whereas 36.4% was made by visitors travelling from over 50km away (See figure 5).
SPEND BY SECTOR
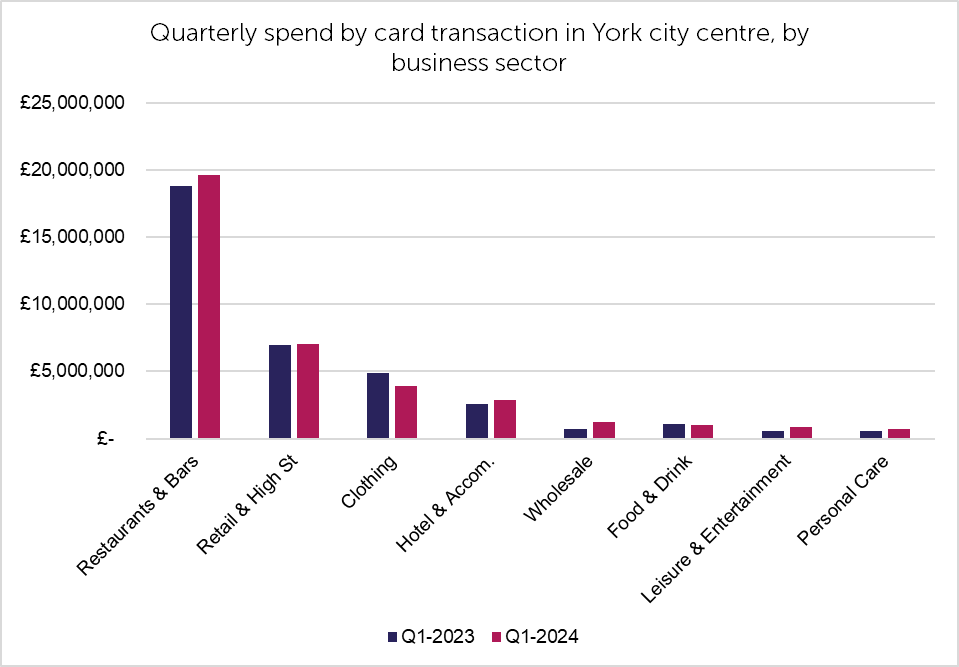
During quarter 1, spend in leisure and entertainment businesses was up by 47.0% compared to the same period in the previous year. Spend in Restaurants & Bars was up by 4.1% and General Retail up by 1.8%. Clothing was down by -19.8% (See figure 6).
INTERNATIONAL SPEND
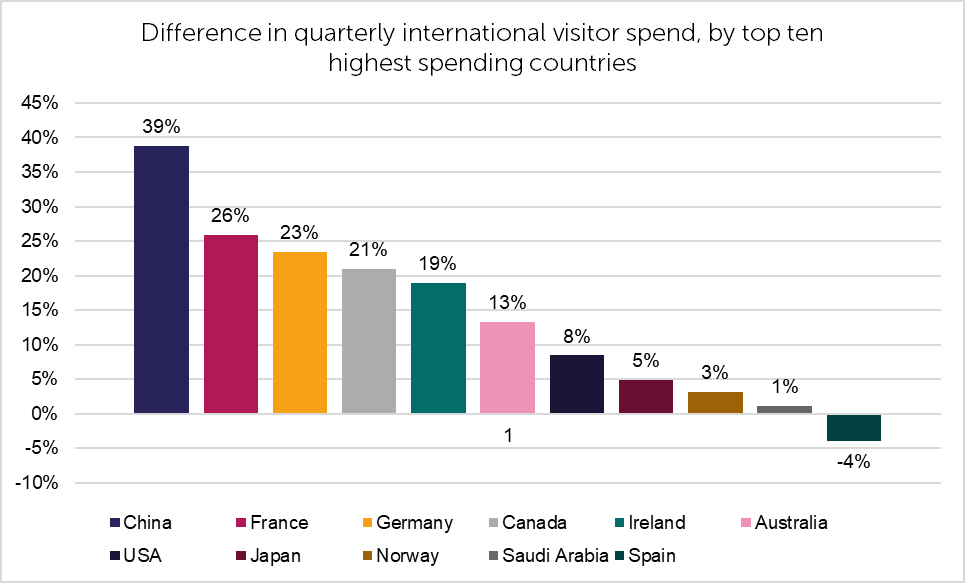
Figure 7 identifies the top ten highest spending countries during quarter 1 (according to VISA) and shows the % year-on-year increase/decrease when compared to the same period in 2023. The most significant uplift was witnessed in spend via card transaction made by Chinese visitors, which increased by 39% compared to the previous year.
As VISA’s market share varies from country-to-country it would therefore be misleading to attempt like-for-like comparisons between the spending totals of different countries.
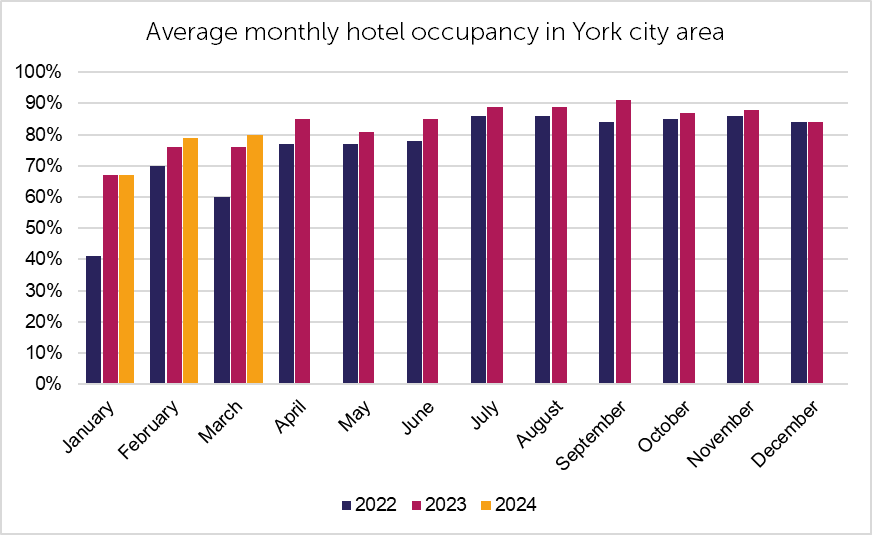
HOTEL OCCUPANCY
Average hotel occupancy during quarter 1 was up by 2.3% compared to the same period in the previous year. The highest monthly occupancy levels were recorded during March which was 4% up compared to the same period in the previous year, and 20% up compared to 2022 (See figure 8).
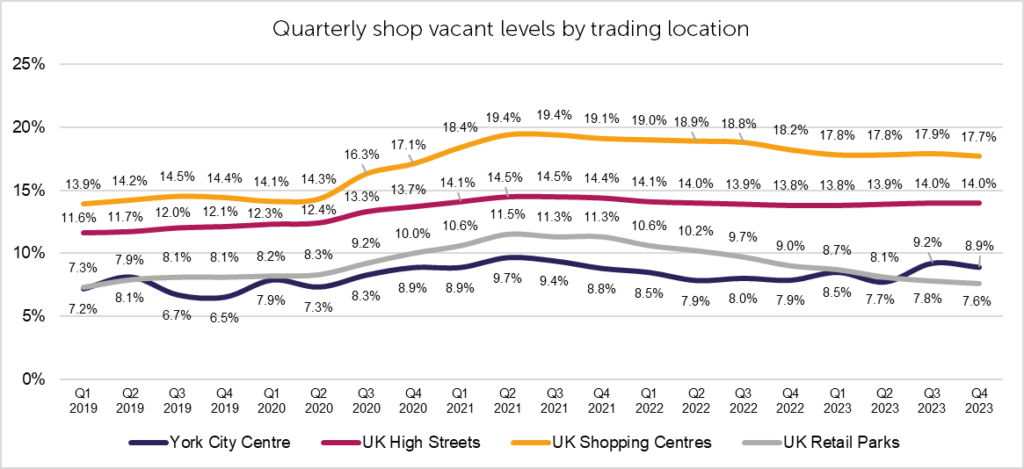
SHOP VACANCY
Shop vacancy levels in York city centre at the end of quarter 4 stood at 8.9%, which is a 1% increase on the same period in the previous year, but -0.3% down on the previous quarter. York city centre vacancy levels have remained well below the national average for UK high streets for several years, which was last recorded at 14.0% (See figure 9).
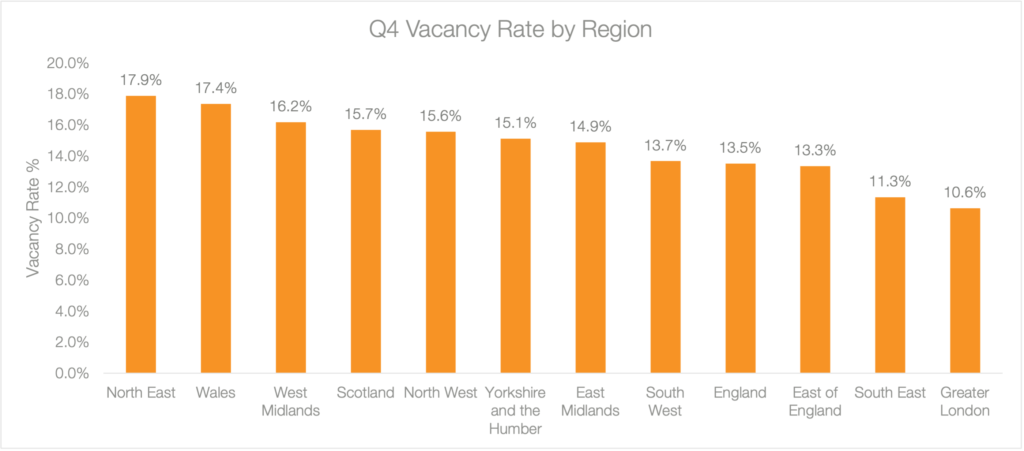
The average vacancy rate for Yorkshire and the Humber was recorded at 15.1%, at the end of 2023, standing at 6.2% higher than York (See figure 10).
To see our previous reports, please visit our Insights & Trends page. If you have any questions regarding the data, you are welcome to contact a member of the BID Team at chris.bush@theyorkbid.com.