
York City Centre Insights Q2-2024

York BID works regularly with data suppliers to bring together insights on the economic performance of York city centre. Our quarterly report references key metrics such as footfall, spend and visitor origins, as an indicator of commercial success across a 3 month period (April-June 2024).
We invite businesses to engage with the trend figures, and compare and contrast with their own data sources to support their day-to-day operations.
All merchant and customer data shown is strictly anonymised and aggregated to comply with GDPR and data protection requirements.
FOOTFALL
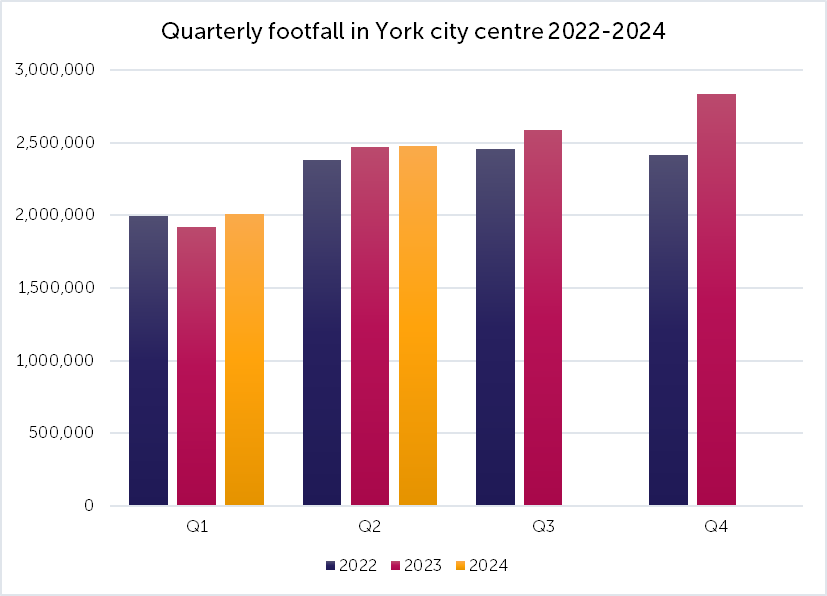
The number of visitors to York city centre recorded during Q2 2024 was up by 0.2% compared to the same period in the previous year (See figure 1).
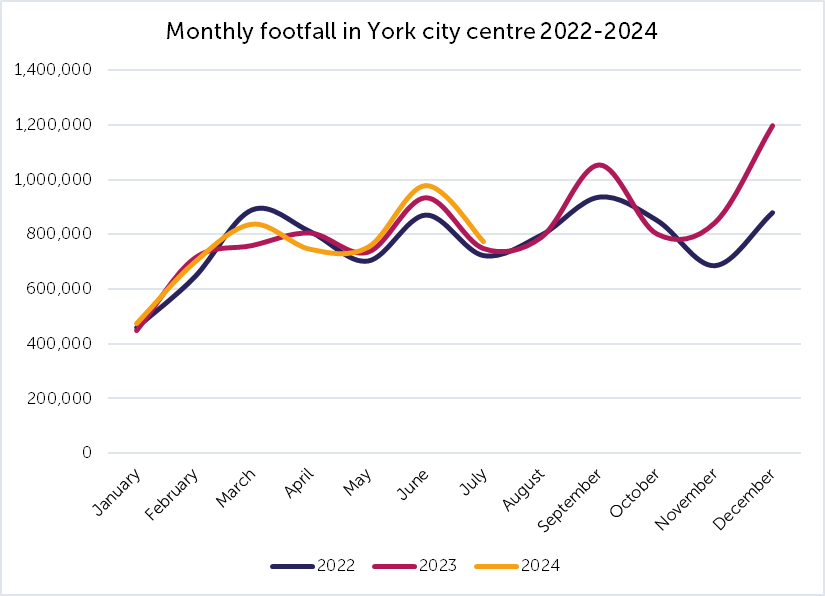
At the end of June 2024, Year-to-date footfall was up by 2.5% compared to 2023. The highest number of monthly visitors was recorded during June, which was up by 4.9% compared to the previous year (See figure 2).
Comparatively, Year-on-year footfall in North Yorkshire was down by -3.4% during Q2 2024, and down by -1.1% across the rest of the UK.
Source: Springboard (Powered by MRI) utilises on-location cameras to measure passing footfall in town and city high streets. There are currently two footfall cameras located in York city centre, on Parliament Street and Micklegate.
Although the dataset is limited, the figures indicate how footfall trends change overtime. New data reports are published on both a weekly and 4-weekly basis.
Click to see the Springboard Footfall Report – June 2024
SPEND
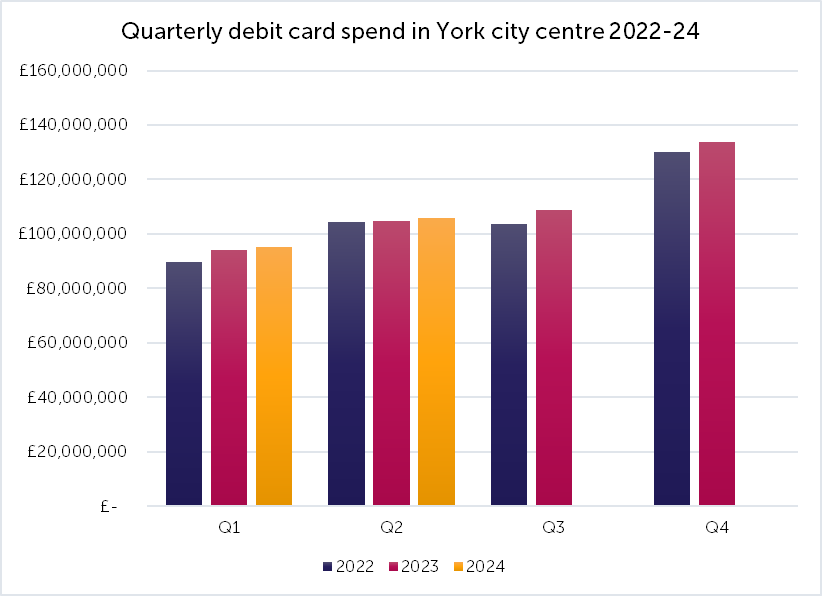
The level of in-store spend made by debit card in York city centre during Q2 was up by 1.0% compared to the same period in the previous year (See figure 3).
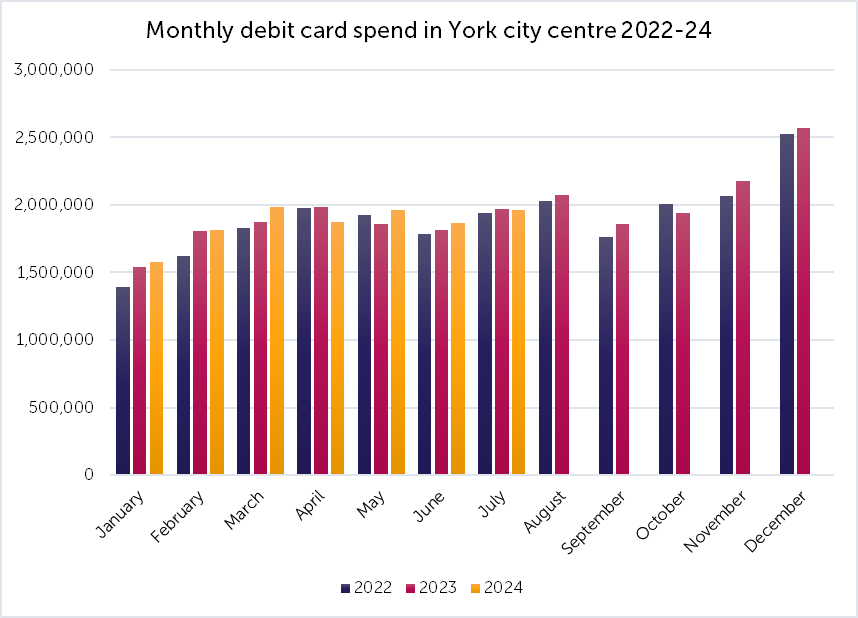
At the end of June 2024, year-to-date spend was up by 1.1% compared to 2023. The biggest year-on-year increase in monthly spend levels was recorded during May, which was up by 8.5% compared to the previous year (See figure 4).
Comparatively, debit card spend during Quarter 2 across the rest of the UK was down by -5.1%.
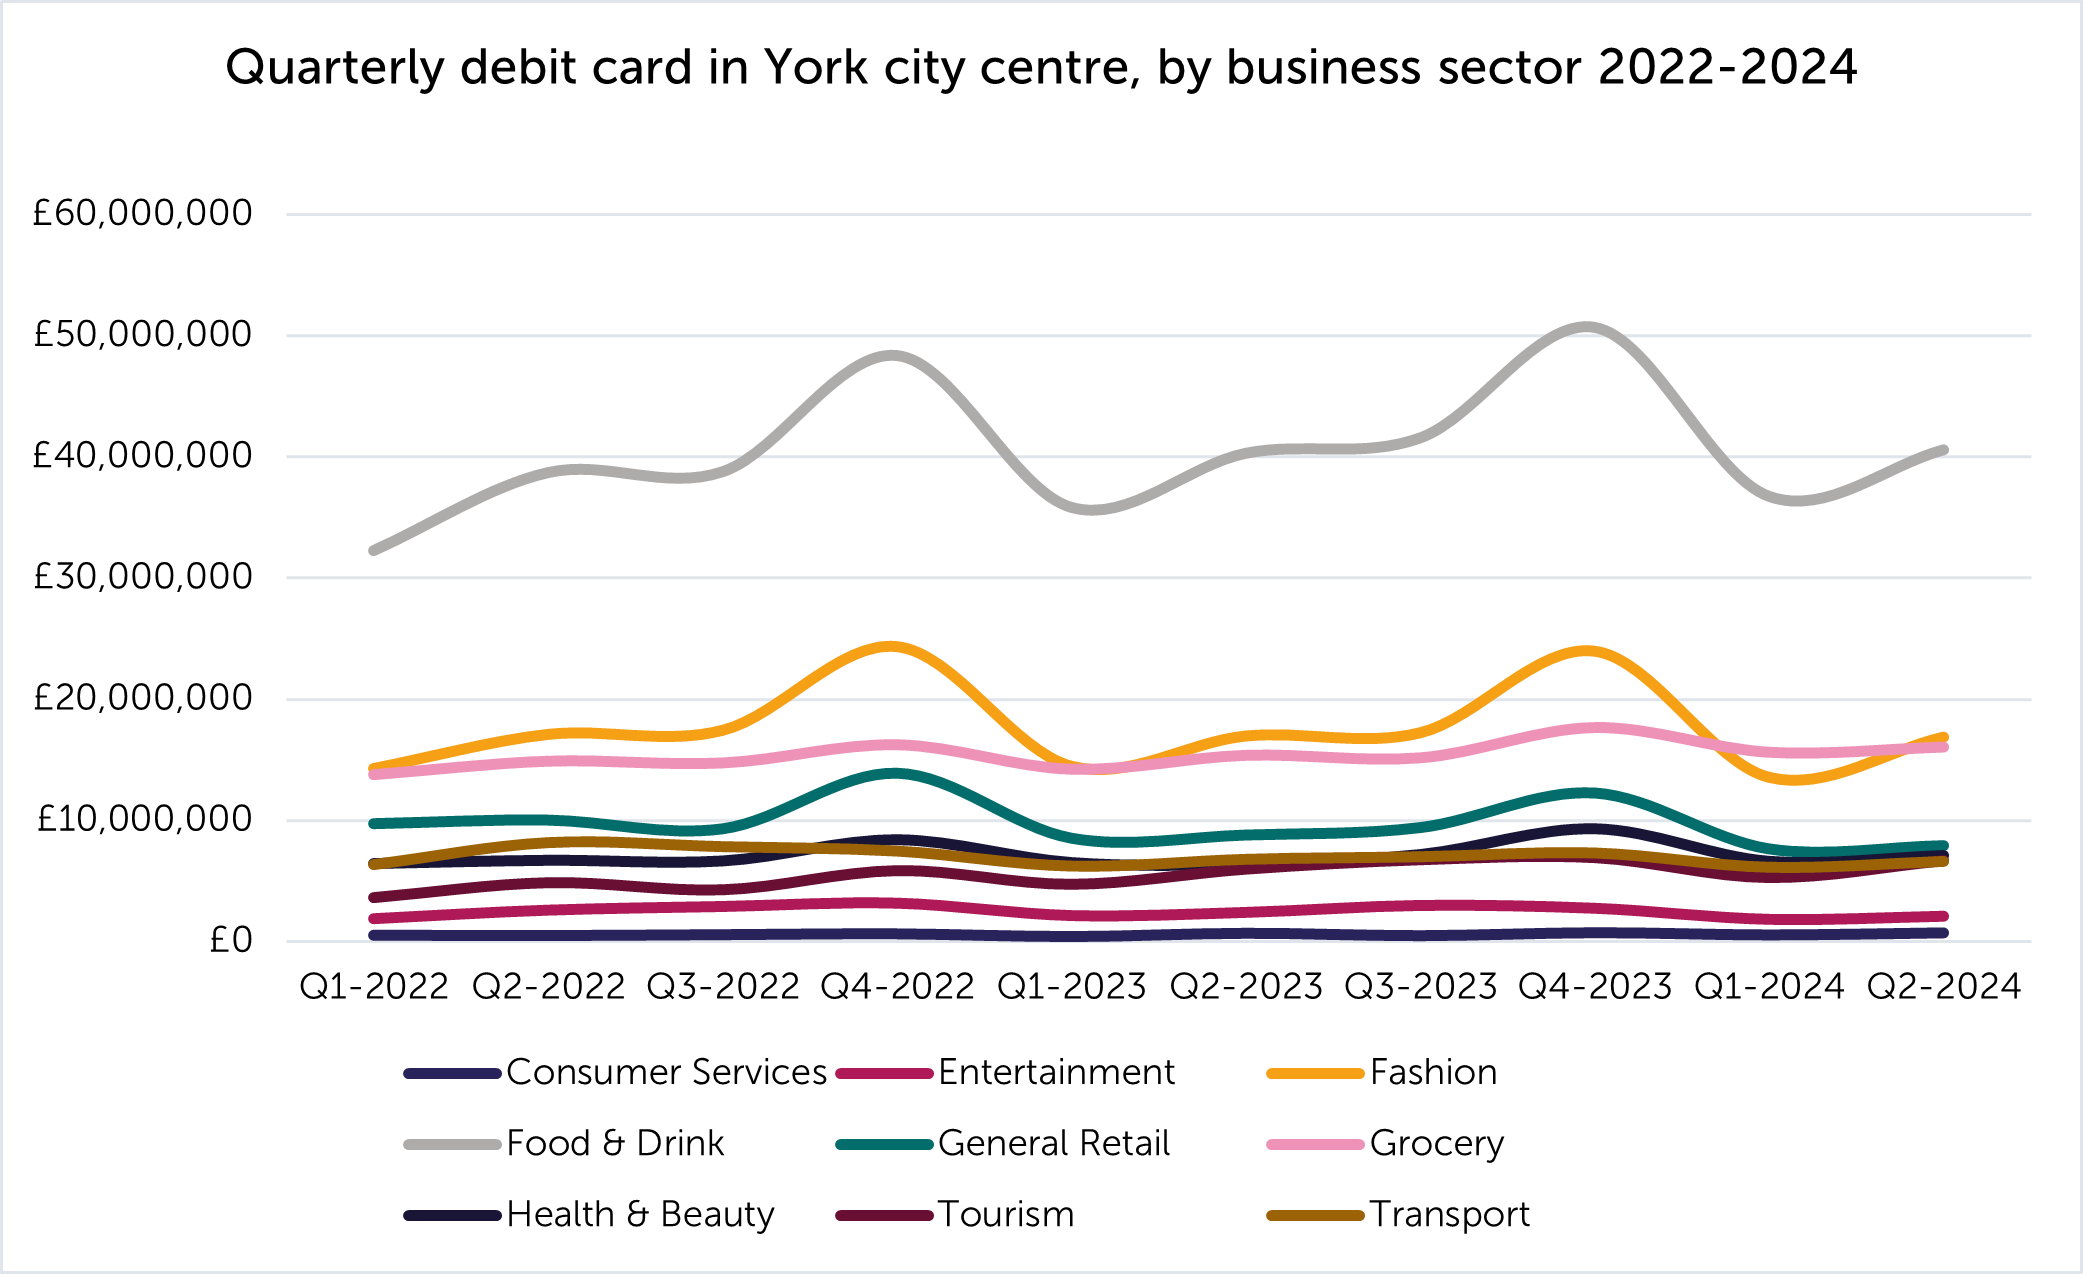
During Q2, the Tourism sector saw the biggest year-on-year increase in spend by 11.7%, General Retail was down by -10.0%. As usual, Food & Drink took the ‘lion’s share’, accounting for 38.4% of the quarterly total, and was slightly up compared to the previous year by 0.7% (See figure 5).
The year-on-year number of card transactions was up by 0.7%, whereas the average transaction value was up by 0.4% (See figure 6).
Source: Beauclair offers access to a national data-set of in-store debit card transactions from over 11 million individual accounts which can be utilised to calculate spending at city wide and national levels.
Each transaction is geo-tagged to track merchant location, retail sector and online vs offline. New data reports are published monthly.
Click to see the UK Benchmark Report – June 2024
VISITOR ORIGINS
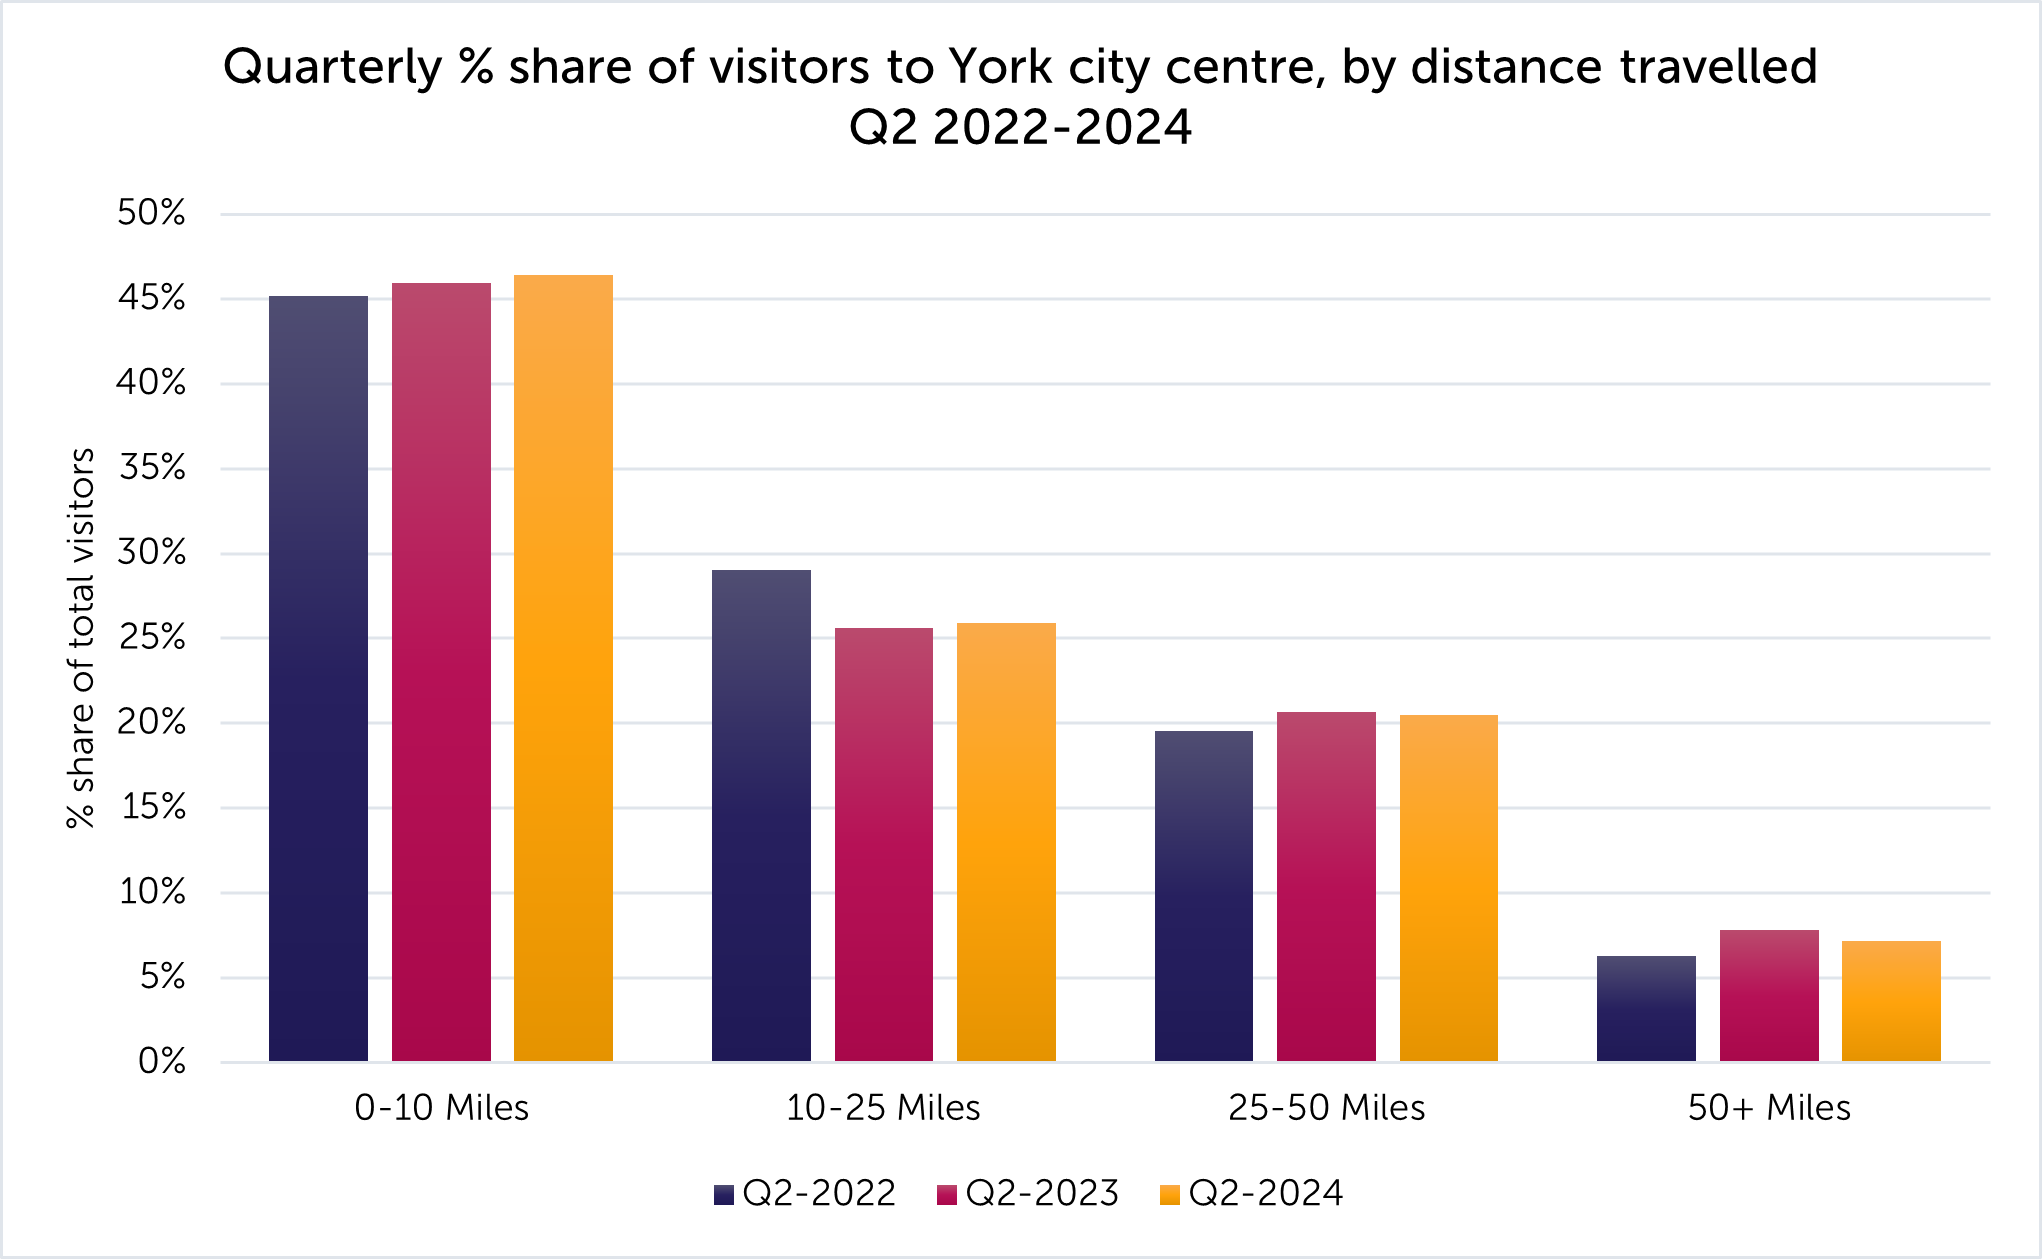
Out of the total number of visits recorded during Q2, 46% were made by residents within a 10 mile radius of the city centre, whereas 28% travelled from 25 miles away or further (See figure 7).
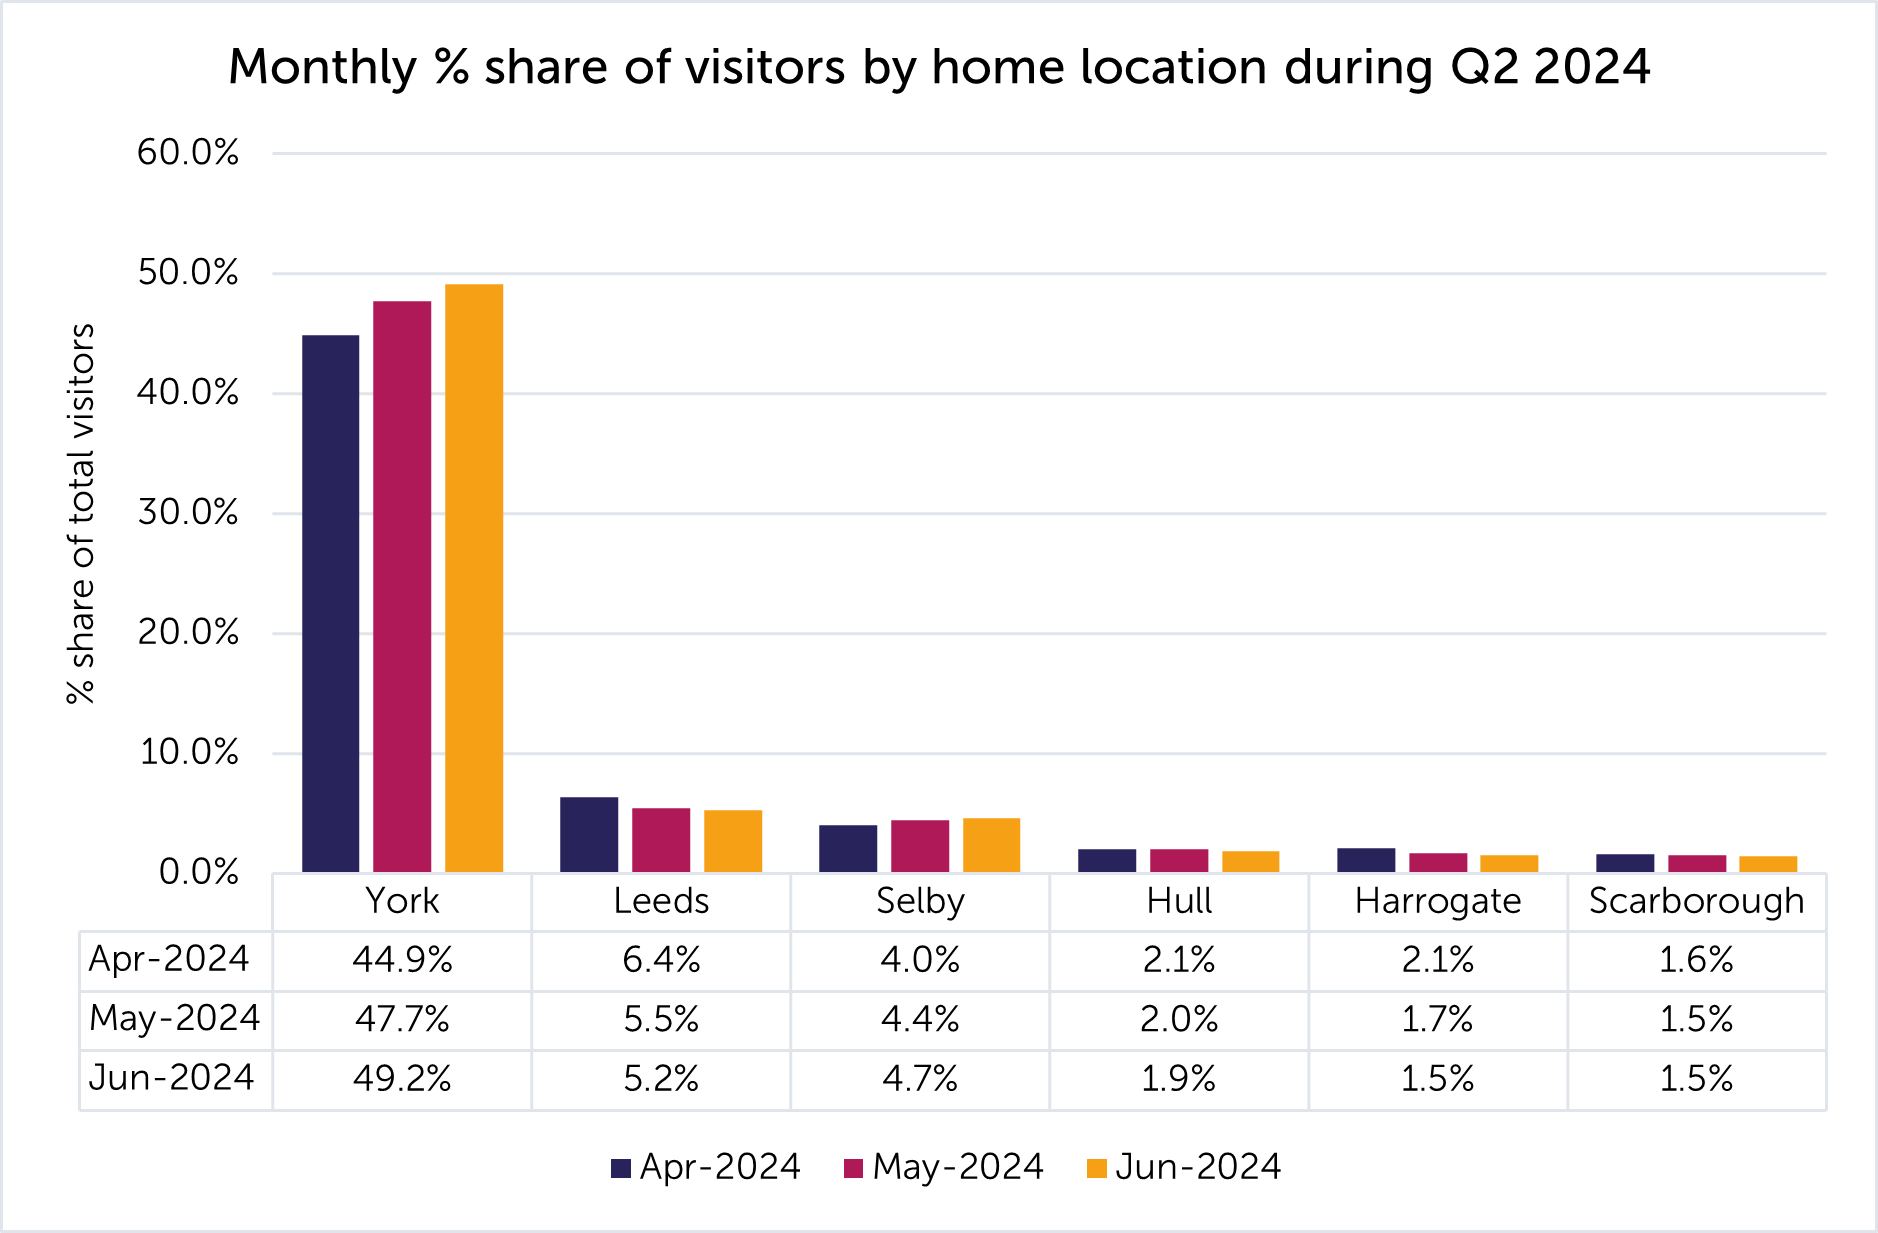
During quarter 2, the % share of visitors to the city centre from the York Local Authority Area increased from 44.9% in April to 49.2% in June. Leeds and Selby were consistently the second and third highest visitor locations of origin throughout the quarter (See figure 8).
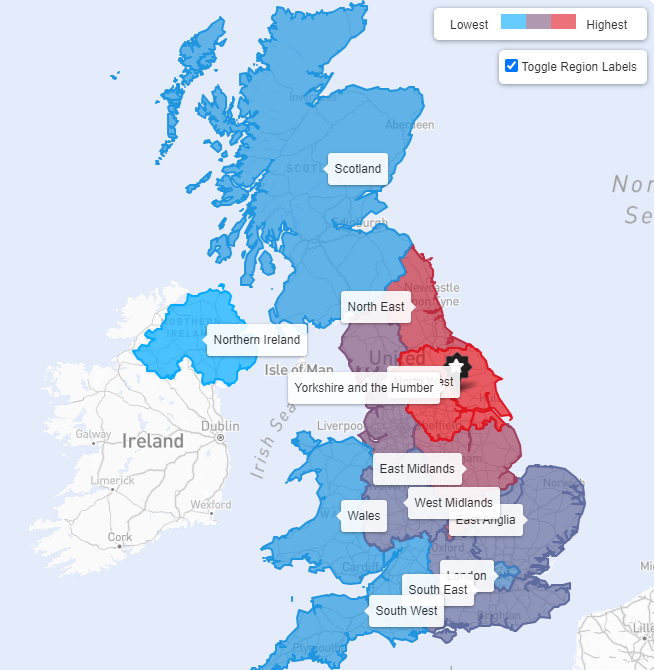
PlaceInformatics tracks the movements of over 1 million mobile devices using GPS in the UK to offer insights into visitor behaviour, demographics and home locations. New data reports are published monthly.
To see our previous reports, please visit our Insights & Trends page. If you have any questions regarding the data, you are welcome to contact the BID Team on info@theyorkbid.com.